Projects
Overview
The Projects page presents the list of all the cancer projects involved in the International Cancer Genome Consortium (ICGC).
A cancer project is characterized by a catalogue of genomic abnormalities (somatic mutations, abnormal expression of genes, epigenetic modifications) affecting donors.
Browser
Filtering
ICGC cancer projects can be filtered through the use of filtering facets, much like Advanced Search. Users can use the facets to check off desired attributes within a project file, and all the files with that attribute will be returned. Filters within the same facet, and across multiple facets can be overlapped.
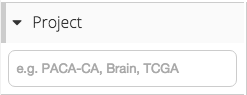 |
Filter by Project ID |
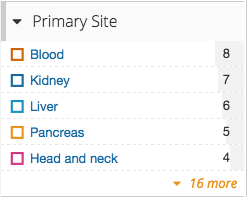 |
Filter by Primary Site affected |
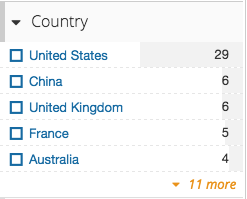 |
Filter by Project Country origin |
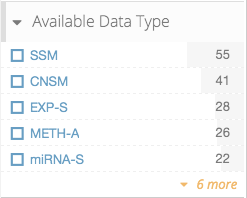 |
Filter by Available Data Type |
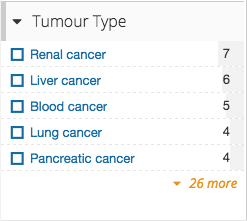 |
Filter by Tumour Type |
Tabs
When looking at the projects returned from filtering, a user can switch between looking at a Summary, the Details, or the History of the projects.
Summary

The summary tab allows a user to visualize general statistics on the current set of projects, which can be filtered through Filtering.
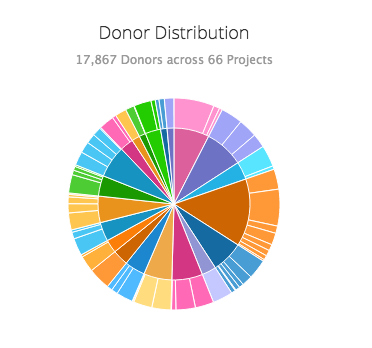
The Donor Distribution pie chart allows a user to see the amount of donors corresponding to each Primary Site. The inner circle displays how many donors contribute to a generalized site, such as Blood or Brain, whereas the outer circle splits up the different projects in each generalized site, ultimately displaying how many donors are in each project as well.
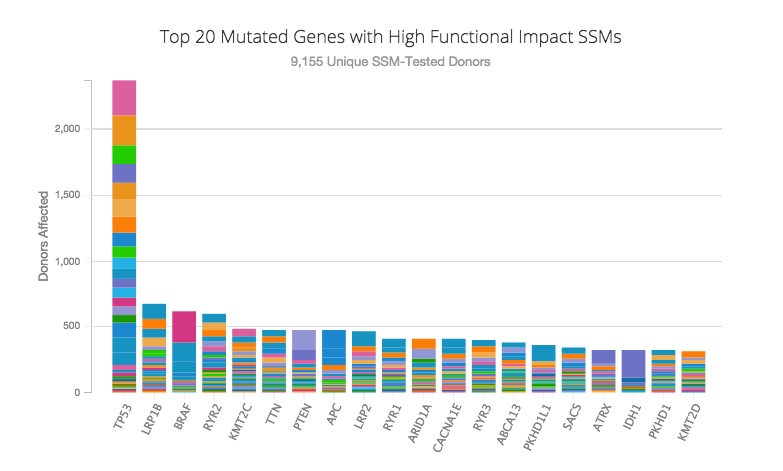
The Top 20 Mutated Genes with High Functional Impact SSMs chart visualizes the comparison between the top 20 mutated genes with high functional impact SSMs. The chart shows how many donors are affected by each of the top 20 genes.
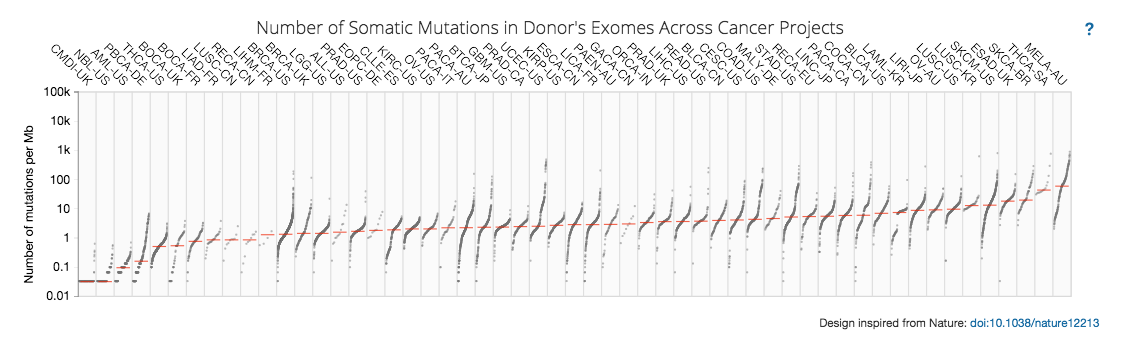
The Number of Somatic Mutations in Donor's Exomes Across Cancer Projects chart visualizes the number of mutations per megabase.
Details
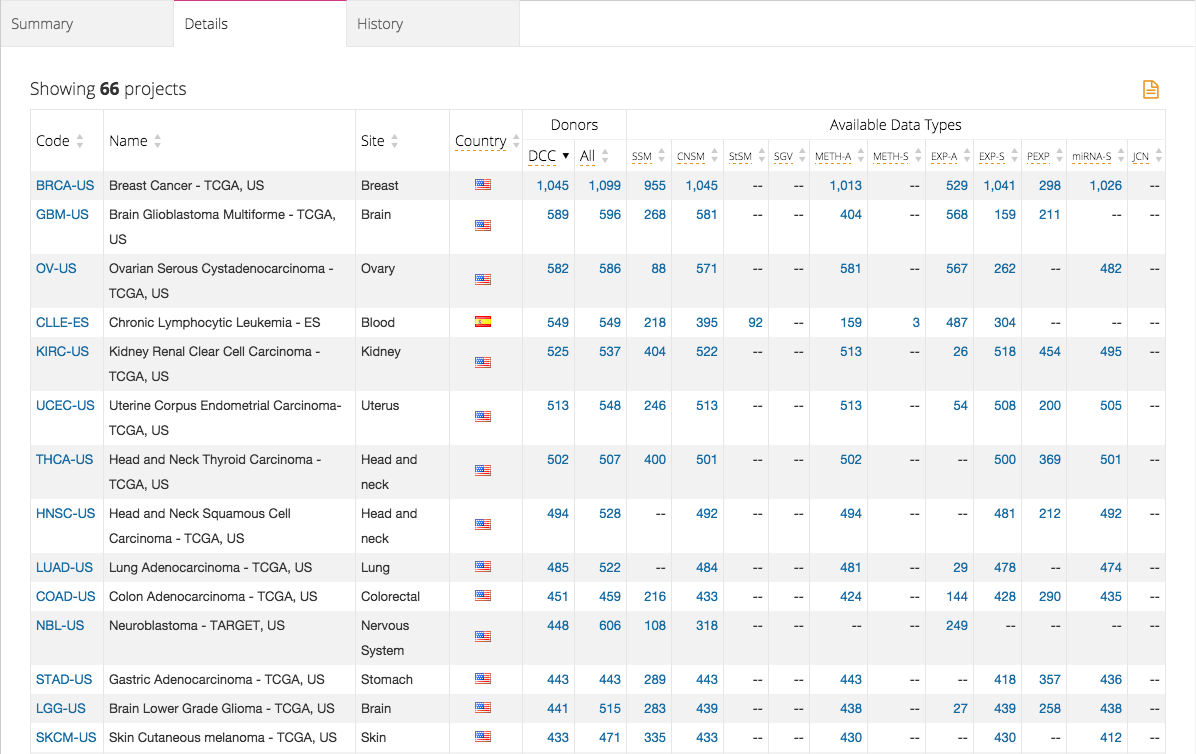
The details tab allows a user to visualize detailed statistics on each project within the current set of projects, which can be filtered through Filtering.

If a user is satisfied with the table generated, they can export and download the table as a TSV file.
History
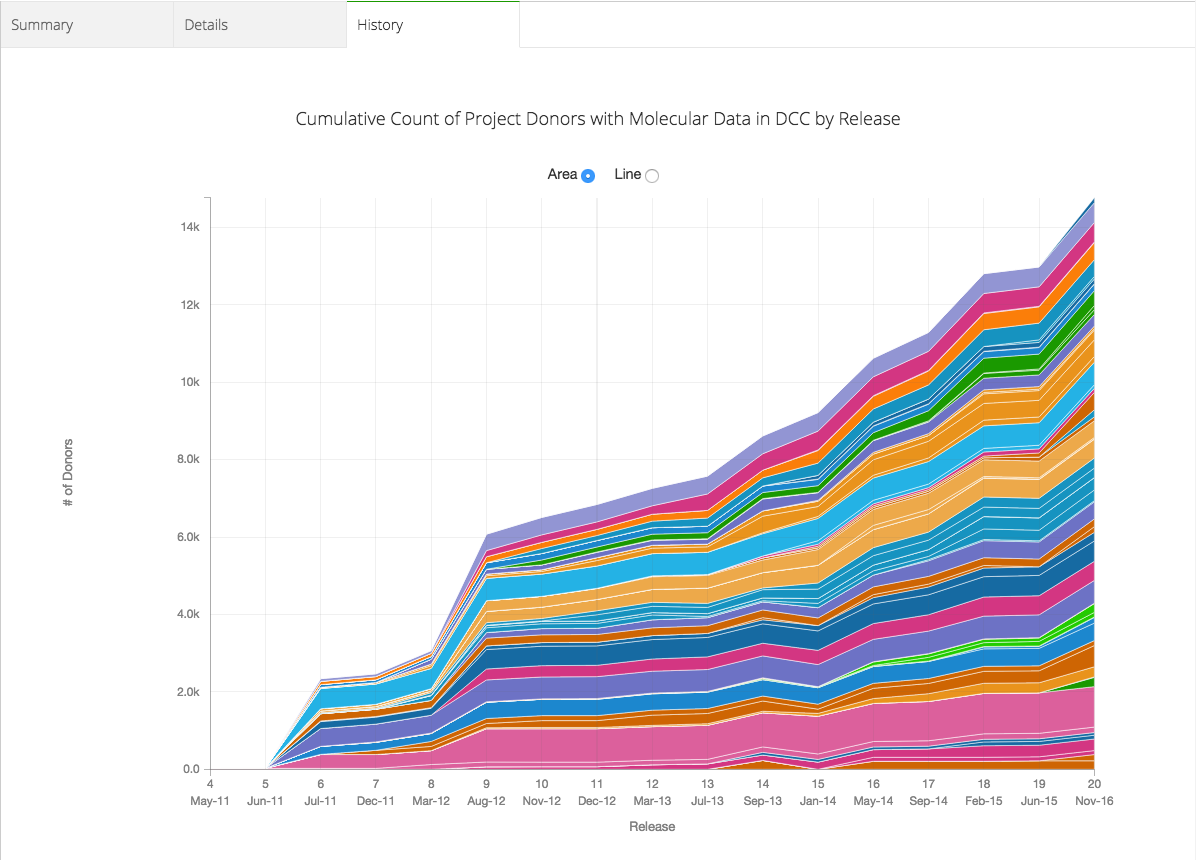
The history tab allows a user to visualize the history of every project in the current set of projects within it's lifetime as a DCC cancer project. Selecting Area will show the cumulative count of Donors of all the projects. The set of projects can be filtered through Filtering.
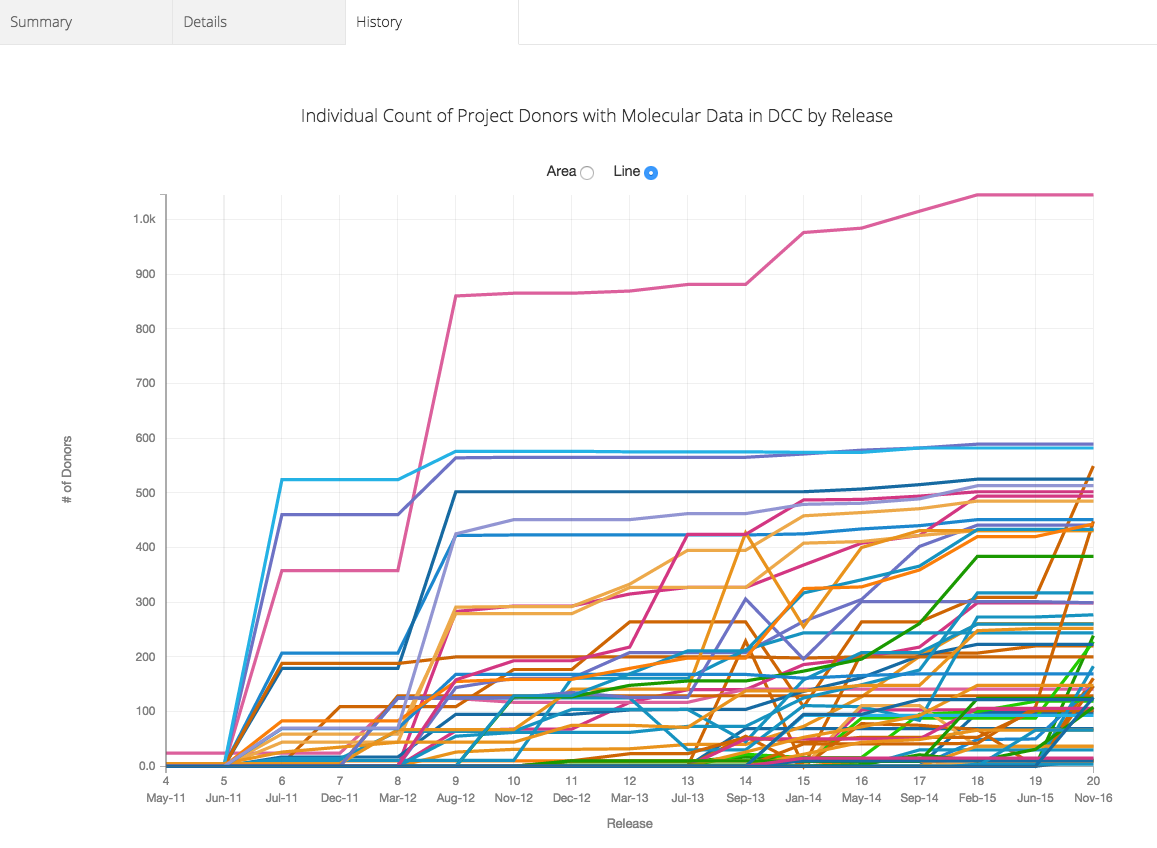
Selecting Line will show the history of the donor count of each individual project.
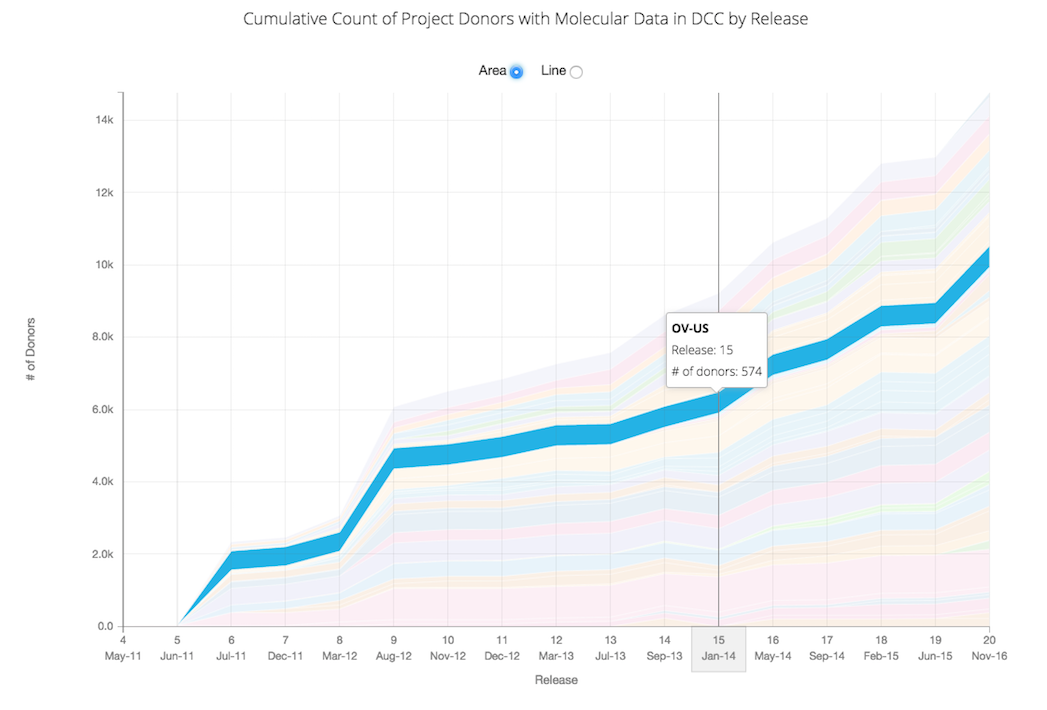
Hovering over a place in the graph allows the user to see the project, the release number and the number of donors at that time. The same functionality exists for the Line graph as well.